-
E-mail
2802943235@qq.com
-
Phone
18702111683
-
Address
No. 253 Yulu Road, Jiading District, Shanghai
Ankerui Electric Co., Ltd
Source Network Load Storage Smart Energy Panoramic Monitoring: Intelligent and Efficient Energy Management New Era Solution
Date: 2025-10-20Read: 21
Introduction:
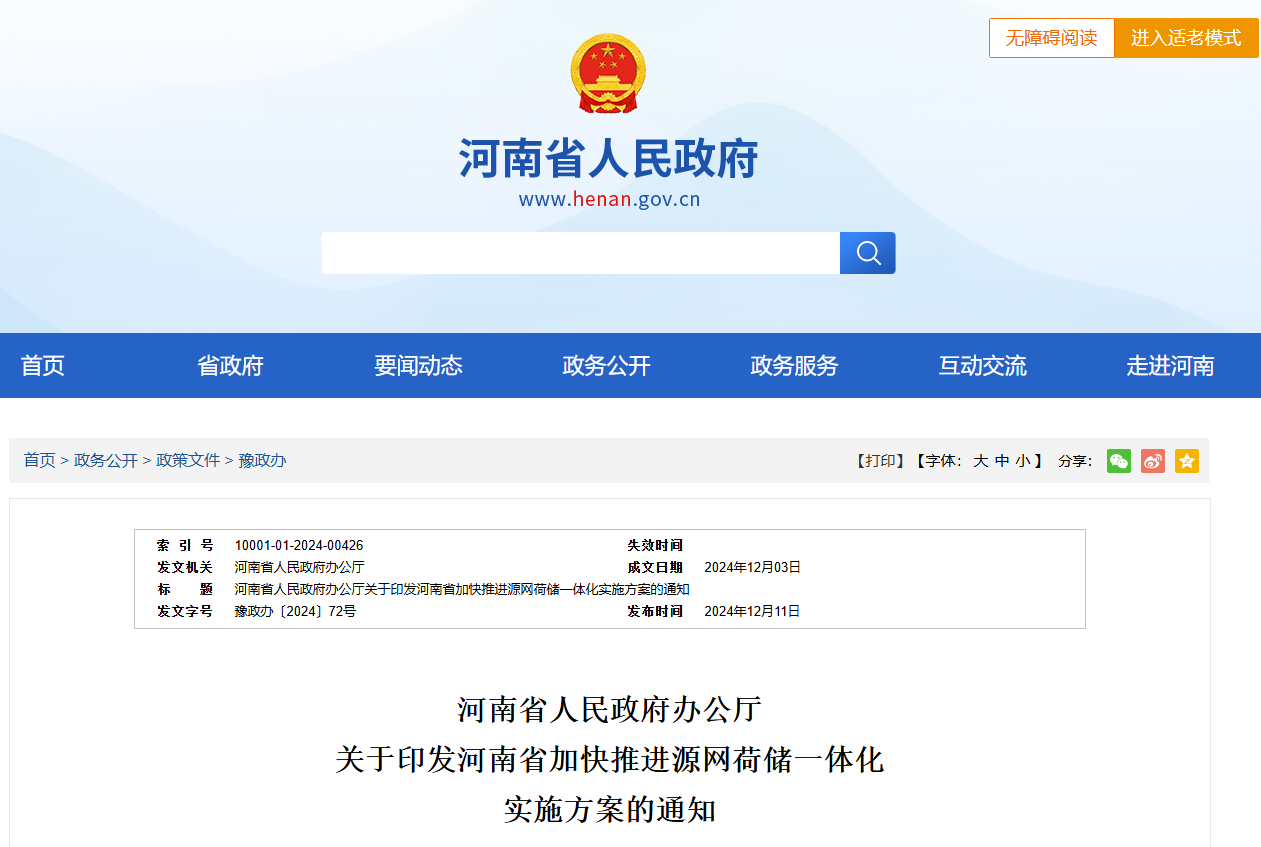
Driven by the global energy transition and the "dual carbon" goal, the energy system is undergoing a profound transformation from one-way transmission to two-way interaction. The integration of source, grid, load, and storage is the core path to building a new type of power system, which achieves dynamic balance between energy production and consumption by integrating power sources, grids, loads, and energy storage resources. The Implementation Plan for Accelerating the Integration of Source, Network, Load and Storage in Henan Province (Yuzhengban [2024] No. 72) issued by the General Office of the People's Government of Henan Province provides a replicable practical model for the whole country. This article combines this solution to systematically explain the implementation framework and technical path of the source network load storage panoramic monitoring solution.
1、 Background of the plan: The urgent need for energy transformation
The Henan Provincial Plan clearly states that the traditional energy system faces three major challenges:
The dilemma of new energy consumption: the proportion of wind power and photovoltaic power is rapidly increasing, but their intermittency leads to a decrease in grid stability and frequent abandonment of wind and solar power.
Low system efficiency: The peak valley difference in industrial parks exceeds 30%, and transformer capacity is severely wasted; The unreasonable energy storage charging and discharging strategy affects economic benefits.
Dual wheel drive of policy and technology: The national "14th Five Year Plan" specifies the development of smart microgrids and promotes the coordination of source grid load storage; Mature IoT and big data technologies provide technical support for panoramic monitoring
II Technical Architecture: Layered Distributed and Open Compatibility Design
device layer:
Integrated multifunctional power meters, inverters, charging stations and other equipment, supporting communication protocols such as ModBus and IEC60870-5-103, compatible with mainstream manufacturers' products.
Deploy temperature sensors and electrical fire monitoring equipment to achieve comprehensive perception of the environment and safety status.
Transport Layer:
Adopting embedded data fusion terminal, supporting serial port, network port LoRa、 Multiple interfaces such as fiber optic cables enable local data storage and breakpoint retransmission.
Ensure data security and prevent malicious attacks through encrypted transmission technology.
data layer:
Store real-time/historical data, alarm logs, etc., and provide data access interfaces for third-party systems to call.
Support big data analysis, explore energy consumption patterns, and provide a basis for optimizing strategies.
application layer:
Provide a visual monitoring platform that displays energy flow and equipment status through 3D modeling and dynamic charts. For example, the Tupu software HT implements a "cyberpunk" style visualization of the energy system in the park, supporting 360 degree rotation observation.
Integrate intelligent prediction, fault diagnosis, strategy optimization and other functional modules to achieve automation and intelligence of energy management.
III Core function: Intelligent monitoring of the entire chain
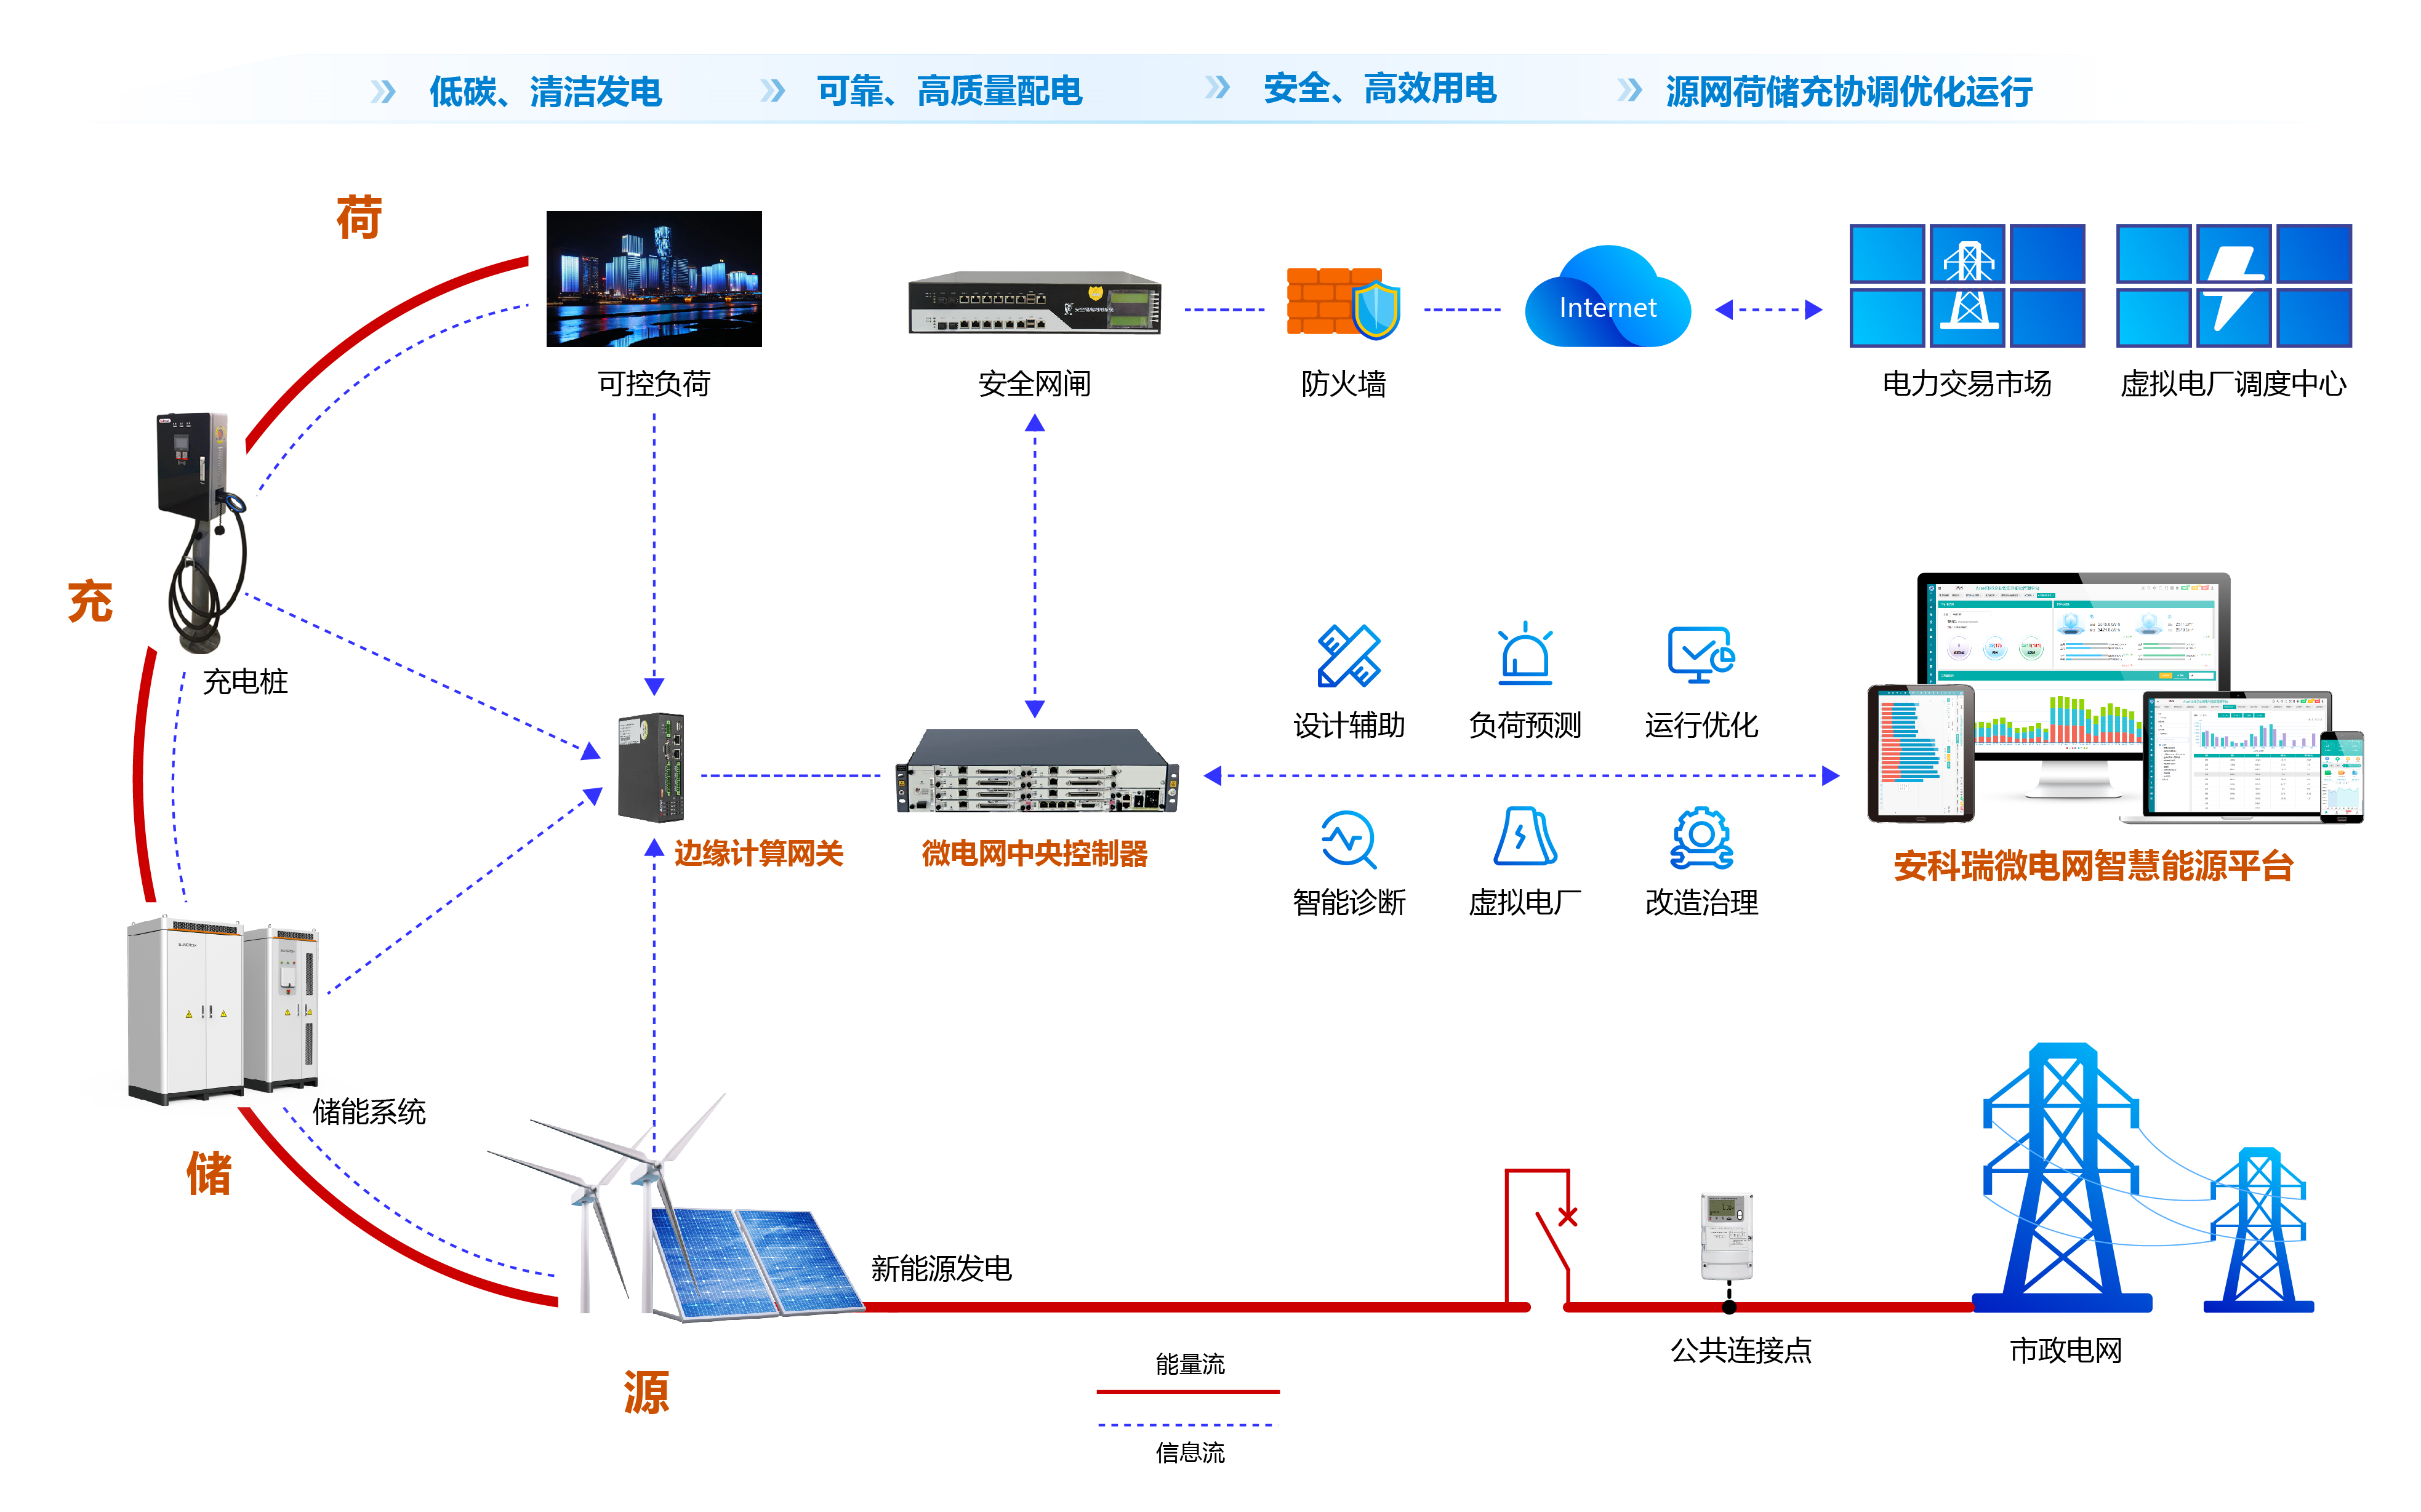
Collaborative optimization of the four major links of "source network load storage", combined with panoramic monitoring technology to achieve dynamic balance:
Energy production end monitoring:
Real time data collection: Monitor photovoltaic panel efficiency and fan speed through sensors, and predict power generation based on meteorological data. AcrelEMS 3.0 solution optimizes photovoltaic output and reduces the rate of wasted light.
Production plan optimization: Based on AI algorithms, dynamically adjust the operation strategy of power generation equipment to improve the consumption rate of new energy.
Monitoring of power grid transmission end:
State perception and interaction: monitoring voltage and current parameters, identifying power grid faults; Coordinate the energy flow between photovoltaics, energy storage, and the power grid through an energy router.
Friendly access mechanism: Adjust the amount of distributed power sources connected according to the load demand of the power grid, and achieve coordinated operation with the large power grid.
Load consumption management:
Refined equipment management: Monitor the electrical characteristics of air conditioning, lighting, and other equipment, and adopt off peak power consumption and energy-saving control strategies. The visualization scheme of Tupu displays the 24-hour load distribution through dynamic curve graphs, guiding users to adjust their electricity consumption behavior.
Orderly charging management: Combining transformer capacity and electricity price signals, coordinating charging pile power to avoid overloading of the power grid caused by centralized charging.
Optimization of energy storage system:
Charge and discharge strategy control: Based on energy production and consumption data, arrange the charging and discharging timing of energy storage equipment reasonably. For example, storing energy during peak periods of photovoltaic power generation and discharging during peak periods of electricity consumption can reduce electricity costs.
Health status monitoring: Real time tracking of battery remaining power, charging and discharging times, prediction of battery life, and optimization of maintenance plans.
4 Implementation path: Multi scenario adaptation and value release
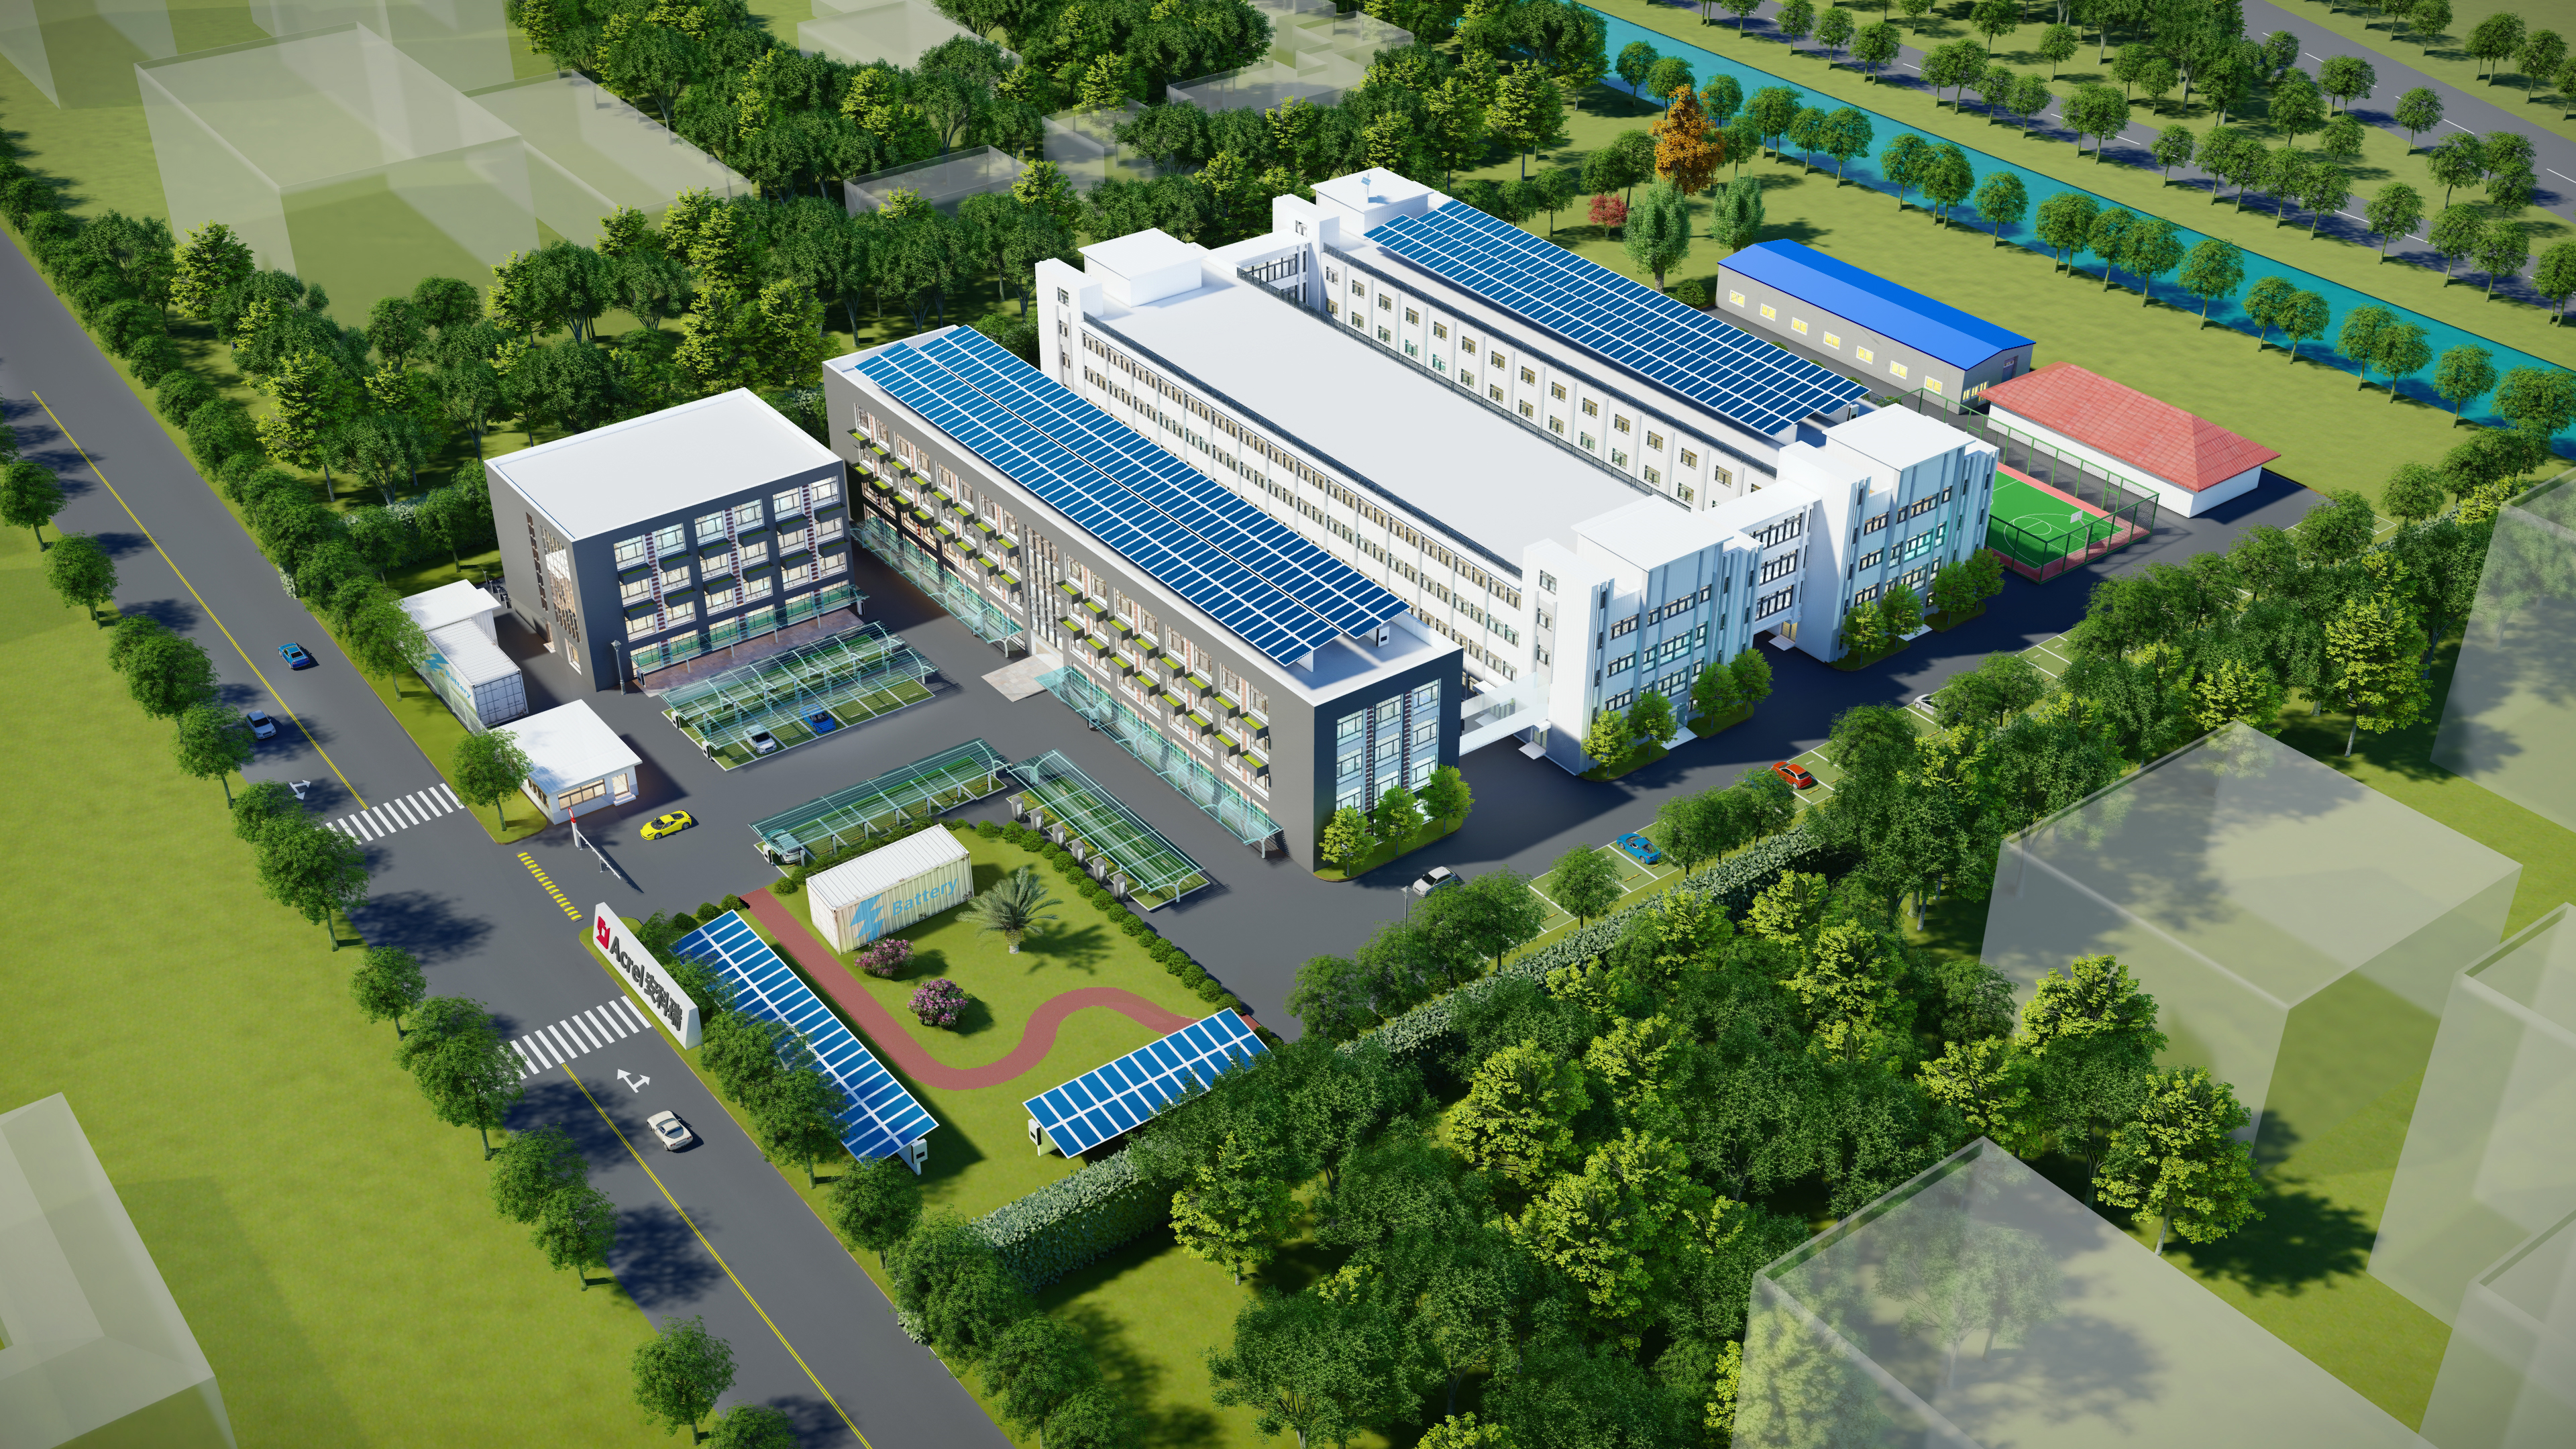
clear planvarious, multiple, diverse, a variety ofImplementation scenarios cover industries, rural areas, service industries, and other fields. The following are typical cases:
Industrial scenario: Integration of source, network, load, and storage in industrial parks
Case: A certain industrial park deploys distributed photovoltaic and energy storage systems and intelligent microgrids, achieving dynamic balance of power generation, consumption, and energy storage through a panoramic monitoring platform.
Value: Save 1.2 million yuan in annual electricity expenses, reduce carbon emissions by 3000 tons, and increase the energy self-sufficiency rate of the park to 65%.
Rural scenario: Whole village development of source network load storage project
Case: A rural area utilizes rooftop photovoltaics and biomass power generation, combined with energy storage systems, to achieve "spontaneous green electricity as the main source and large-scale power grid as the backup guarantee".
Value: Promote rural energy revolution, stimulate rural consumption potential, cultivate and strengthen collective economy.
Public institution scenario: school source network load storage integration
Case: A certain university deployed a photovoltaic+energy storage system, optimized its electricity consumption strategy through a panoramic monitoring platform, and participated in electricity market transactions in combination with demand response mechanisms.
Value: Annual energy cost savings of 800000 yuan, enhancing the intelligent level of campus energy management.
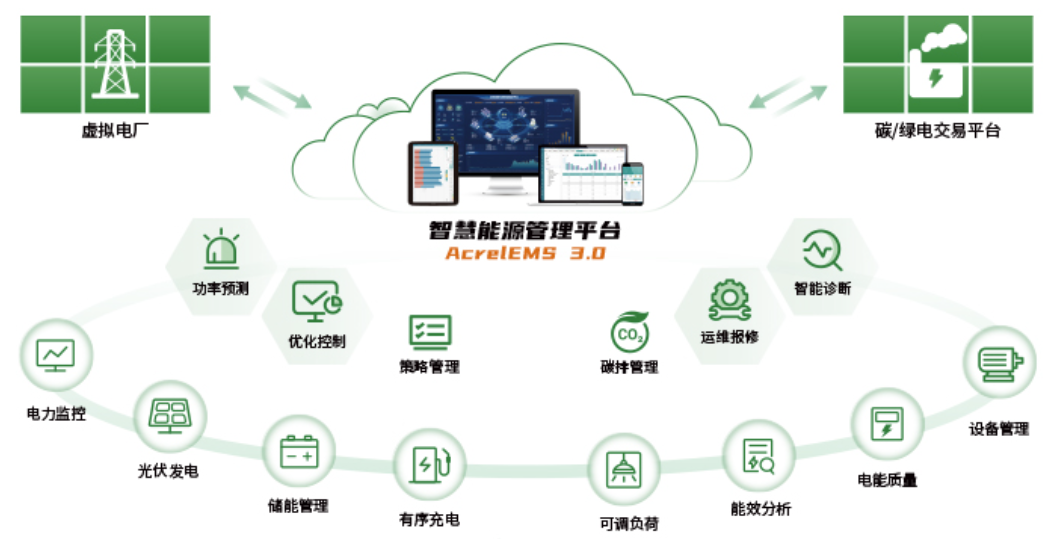
5 Software feature interface display
5.1 Real time monitoring
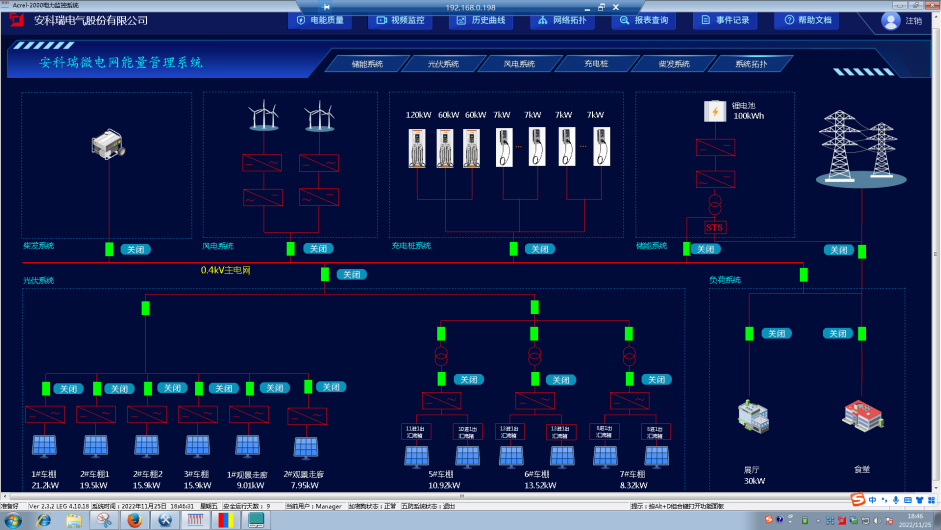
The monitoring system interface of the microgrid energy management system includes the system main interface, which includes the microgrid photovoltaic, wind power, energy storage, charging piles, and overall load composition, including revenue information, weather information, energy conservation and emission reduction information, power information, electricity quantity information, voltage and current situation, etc. According to different needs, charging, energy storage, and photovoltaic system information can also be displayed.
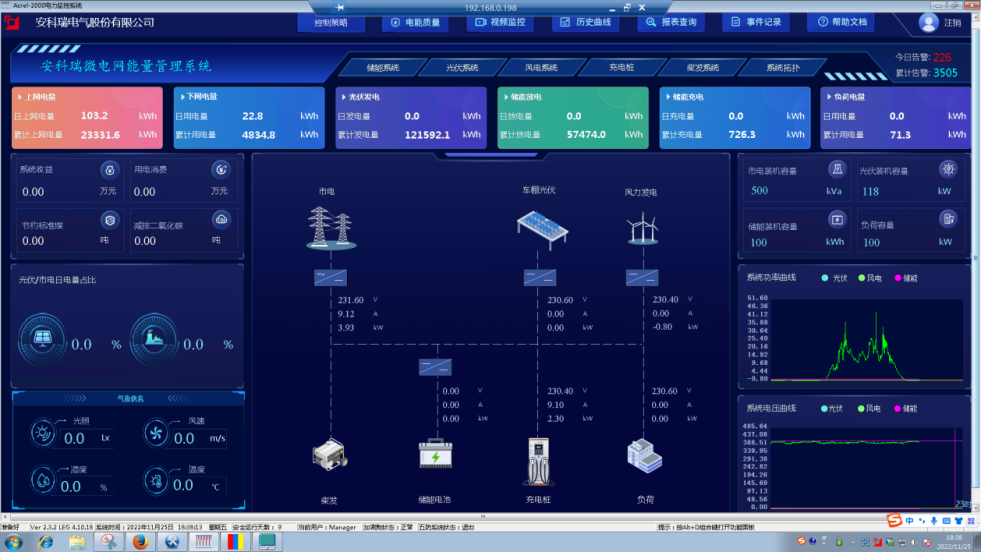
5.2 Photovoltaic Interface
Display information on photovoltaic systems, mainly including monitoring and alarm of the operating status of inverters on the DC and AC sides, statistics and analysis of inverter and power station power generation, monitoring and analysis of grid connected cabinet power generation, statistics of annual effective utilization hours of power station power generation, statistics of power generation revenue, carbon emission reduction statistics, monitoring of irradiance/wind power/environmental temperature and humidity, simulation and efficiency analysis of power generation; Simultaneously display the total power, voltage and current of the system, as well as the operational data of each inverter.
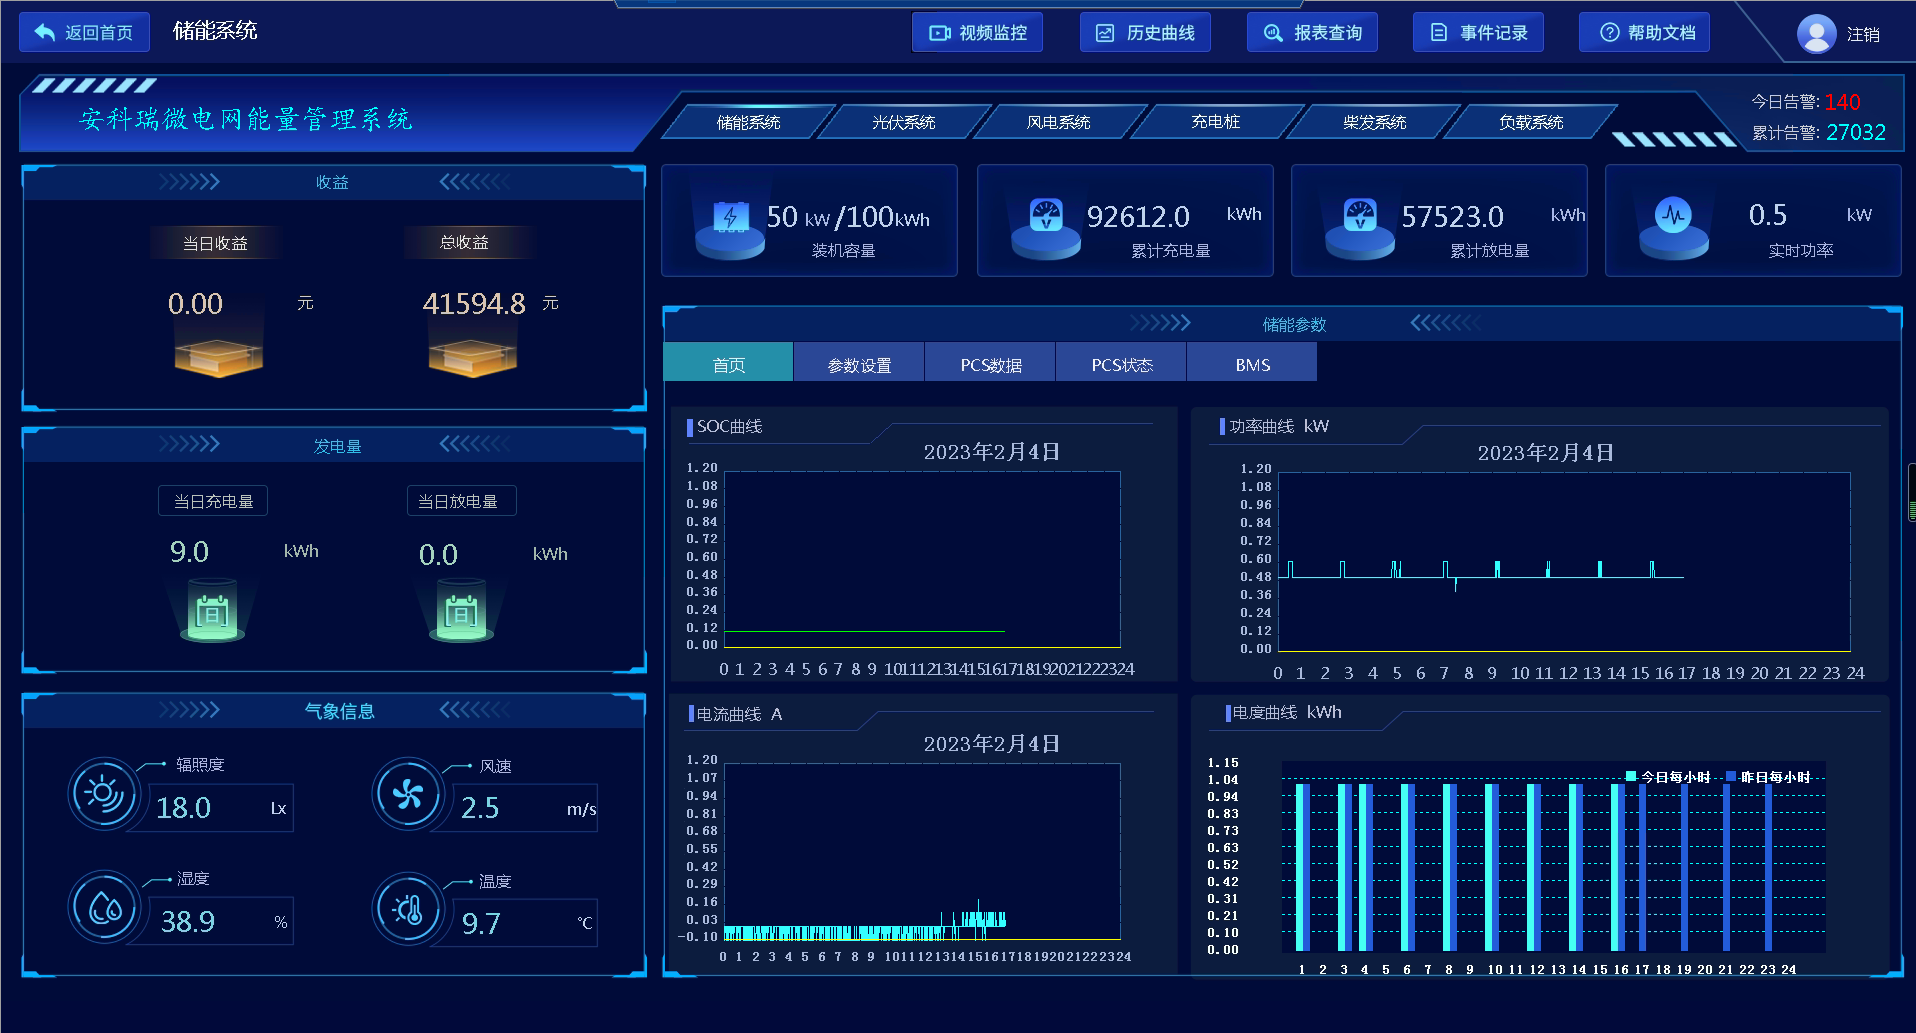
5.3 Energy storage interface
Display the energy storage installed capacity, current charging and discharging capacity, revenue, SOC change curve, and electricity change curve of this system. Data display and control of PCS and BMS.
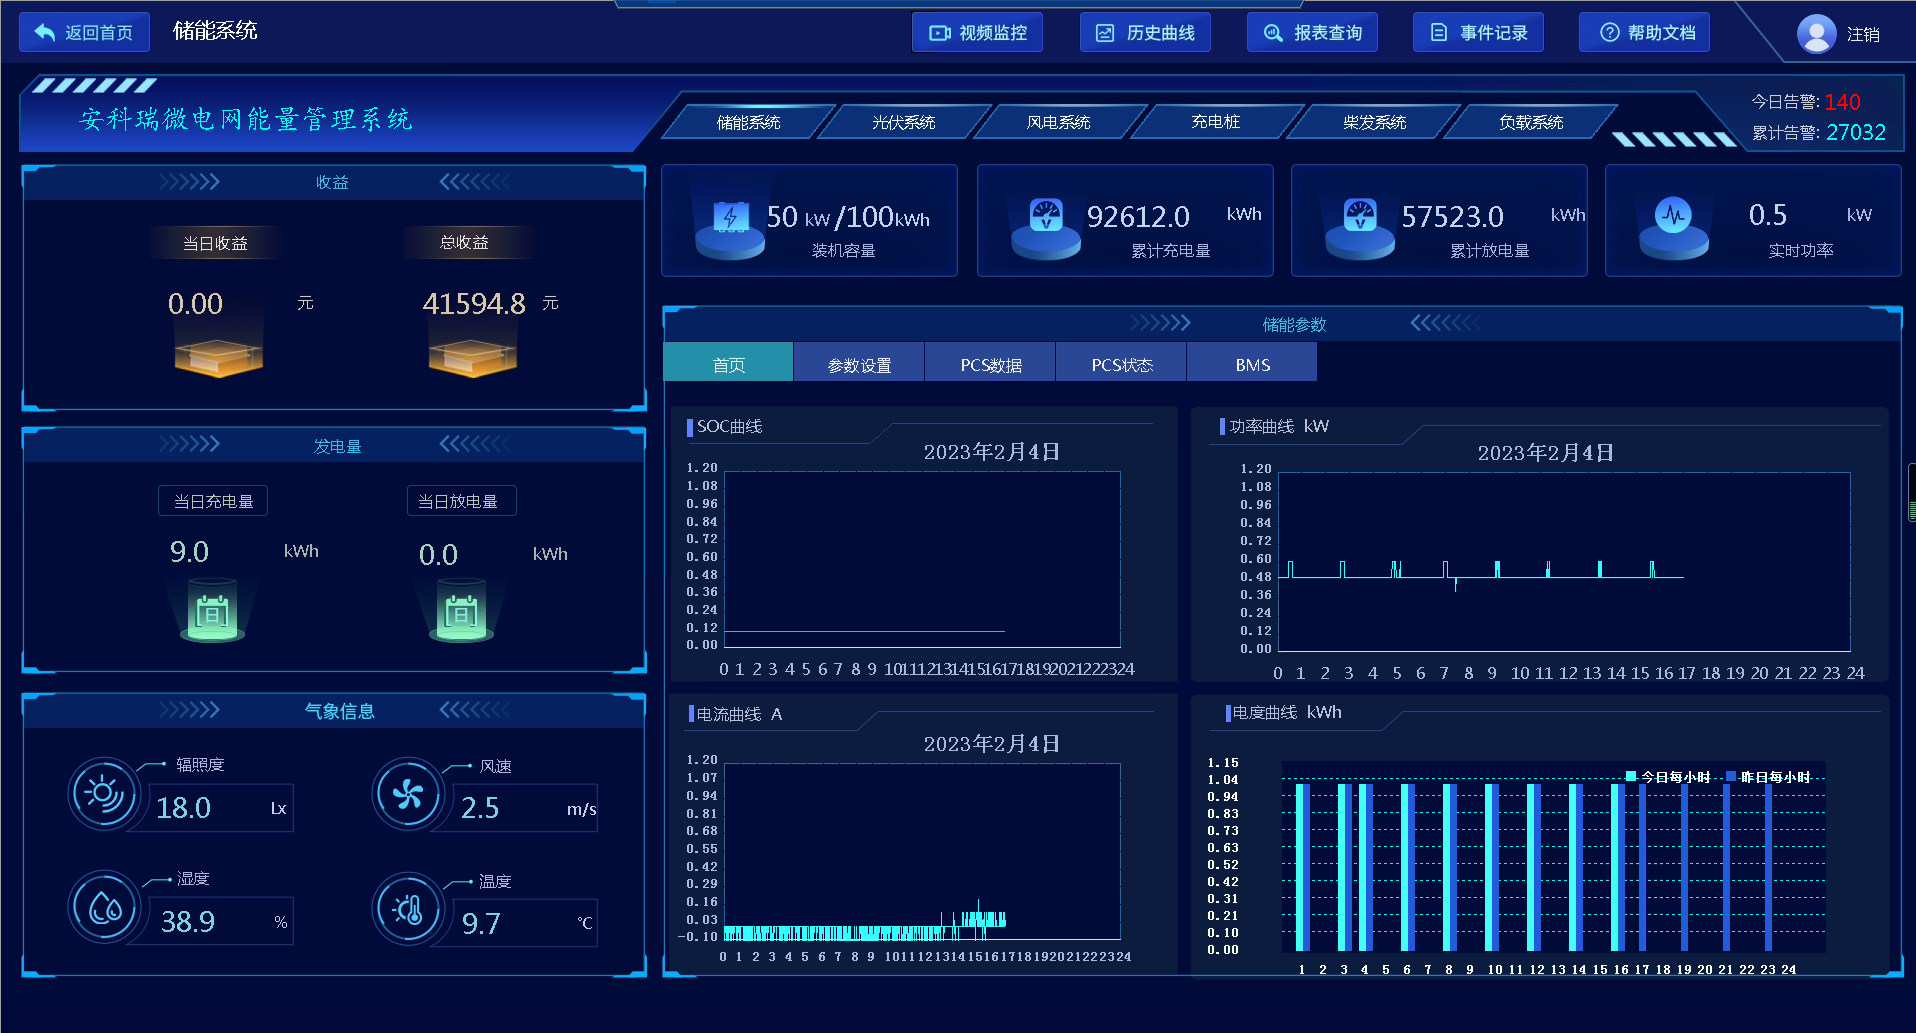
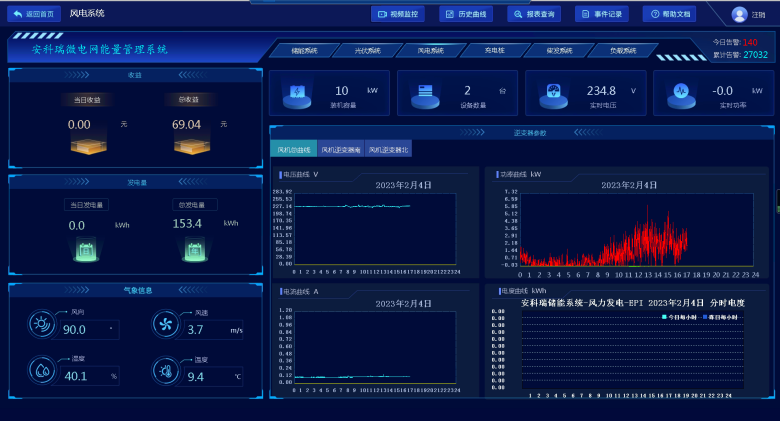
5.4 Wind Power Interface
Display information on wind power systems, mainly including monitoring and alarm of the operation status of the DC and AC sides of the inverter control integrated machine, statistics and analysis of the power generation of the inverter and the power station, statistics of the annual effective utilization hours of the power station's power generation, statistics of power generation income, carbon reduction statistics, monitoring of wind speed/wind speed/environmental temperature and humidity, simulation of power generation and efficiency analysis; Simultaneously display the total power, voltage and current of the system, as well as the operational data of each inverter.
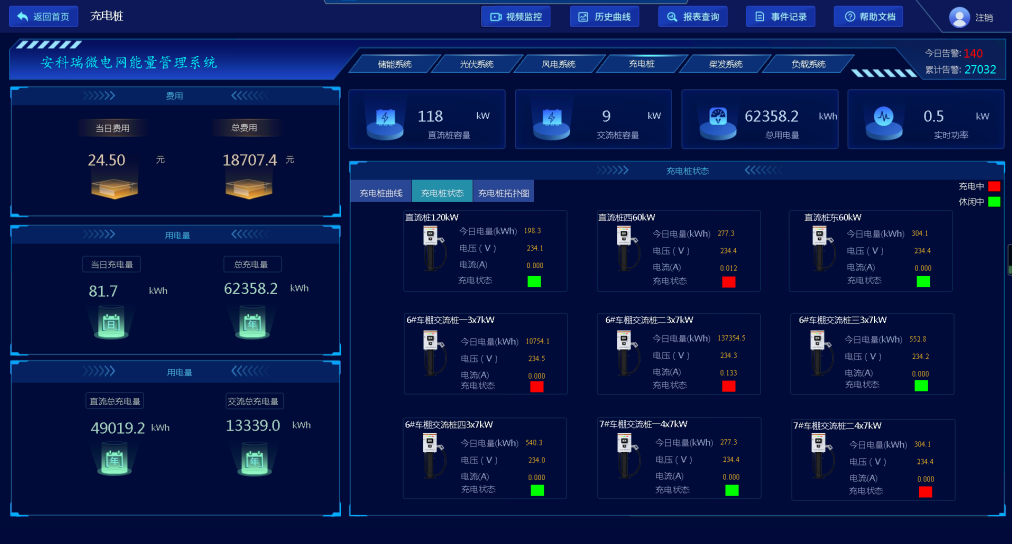
5.5 Charging Station Interface
Display information about the charging station system, mainly including the total power consumption of charging stations, the power and electricity consumption of AC and DC charging stations, electricity costs, change curves, and operational data of each charging station.
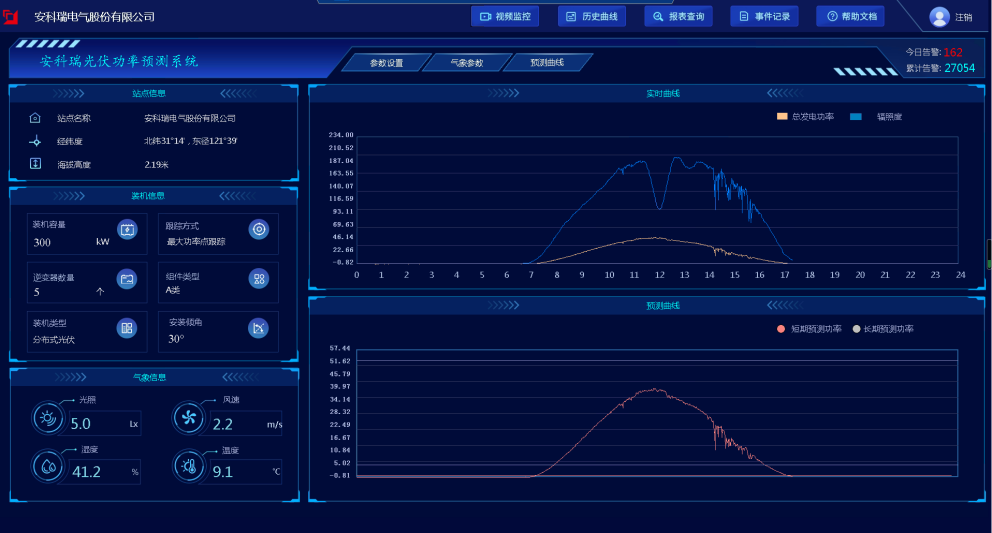
5.6 Power generation forecast
Based on historical power generation data, measured data, and future weather forecast data, predict the short-term and ultra short term power generation of distributed power generation, and display the qualification rate and error analysis. According to power prediction, manual input or automatic generation of power generation plans can be carried out, which facilitates users to centrally control the new energy generation of the system.
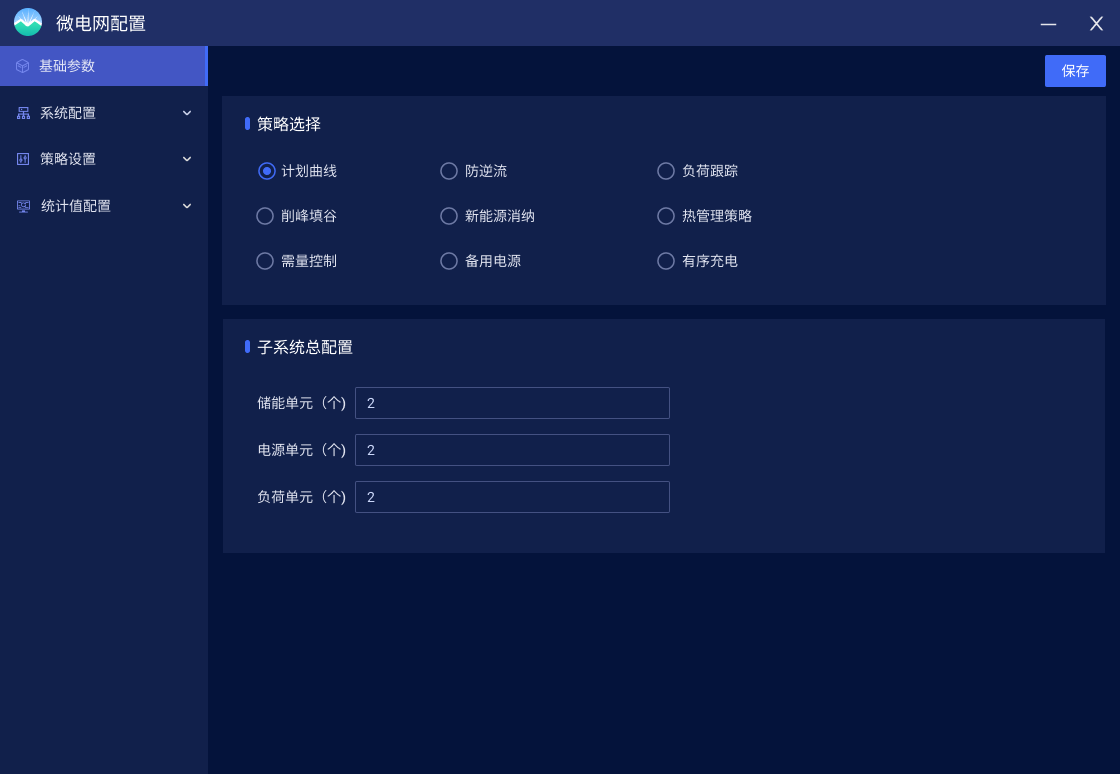
5.7 Strategy Configuration
The system should be able to set the system operation mode and configure different control strategies based on power generation data, energy storage system capacity, load demand, and time of use electricity price information. Such as peak shaving and valley filling, cycle planning, demand control, anti backflow, orderly charging, dynamic expansion, etc.
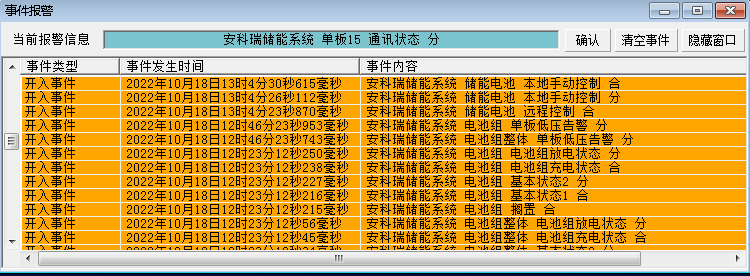
5.8 Real-time alarm
Equipped with real-time alarm function, the system should be able to remotely signal the starting and closing of inverters and bidirectional converters in each subsystem, as well as issue alarms when internal protection actions or accident trips occur. It should be able to display alarm events or trip events in real time, including the name of the protection event and the time of the protection action; And it should be able to notify relevant personnel in the form of pop ups, sounds, text messages, and phone calls.
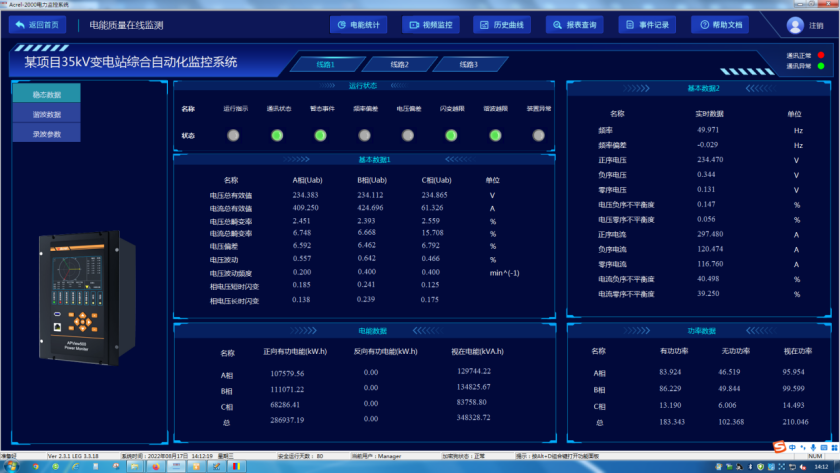
5.9 Power Quality Monitoring
Continuous monitoring of the power quality of the entire microgrid system, including steady-state and transient states, enables management personnel to grasp the power quality situation of the power supply system in real time, in order to timely detect and eliminate unstable power supply factors.
5.10 Network Topology Diagram
The system supports real-time monitoring of the communication status of various devices connected to the system, and can fully display the entire system network structure; It can diagnose the communication status of equipment online, and automatically display the faulty equipment or component and its faulty location on the interface when network abnormalities occur.
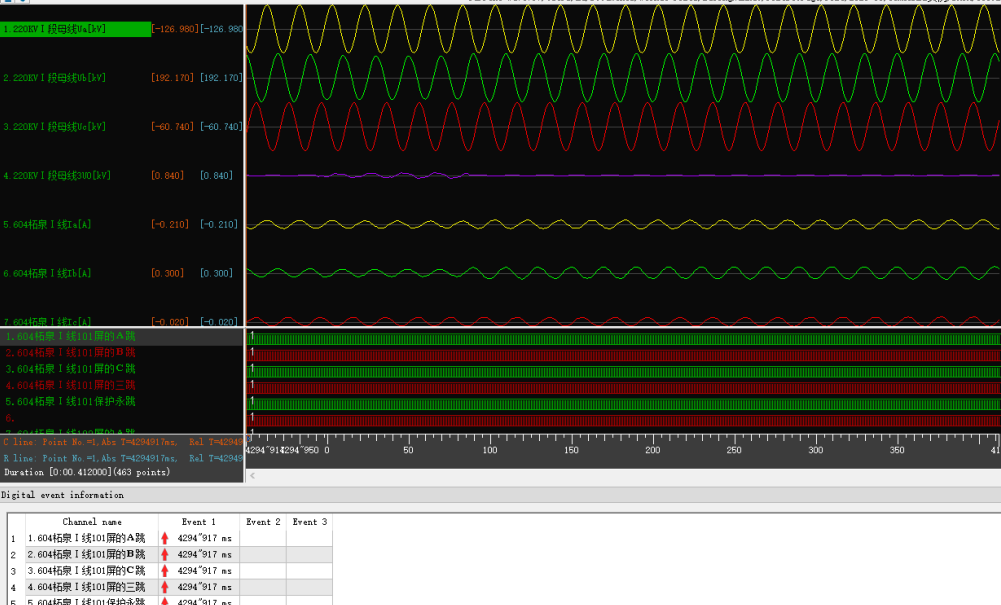
5.11 Fault recording
When the system malfunctions, it automatically and accurately records the changes in various related electrical quantities before and after the fault. By analyzing and comparing these electrical quantities, it plays an important role in analyzing and handling accidents, determining whether the protection is operating correctly, and improving the safe operation level of the power system. Among them, a total of 16 fault waveforms can be recorded, and each waveform can trigger 6 segments of waveform recording. Each waveform recording can record 8 cycles before the fault and 4 cycles after the fault, with a total recording time of 46 seconds. Each sampling point recording should include at least 12 analog waveforms and 10 switch waveforms.
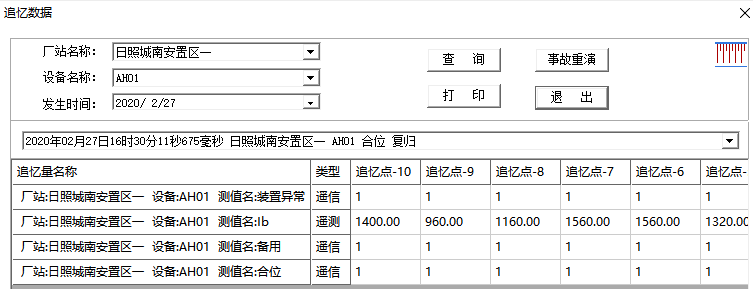
5.12 Accident Remembrance
It can automatically record all real-time scanning data before and after the accident, including switch position, protection action status, remote measurement, etc., forming the data basis for accident analysis;
Users can customize the initiation event for accident recall, and when each event occurs, store relevant point data for the first 10 scanning cycles before the accident and the last 10 scanning cycles after the accident. The data points for initiating events and monitoring can be specified and modified by users at will.
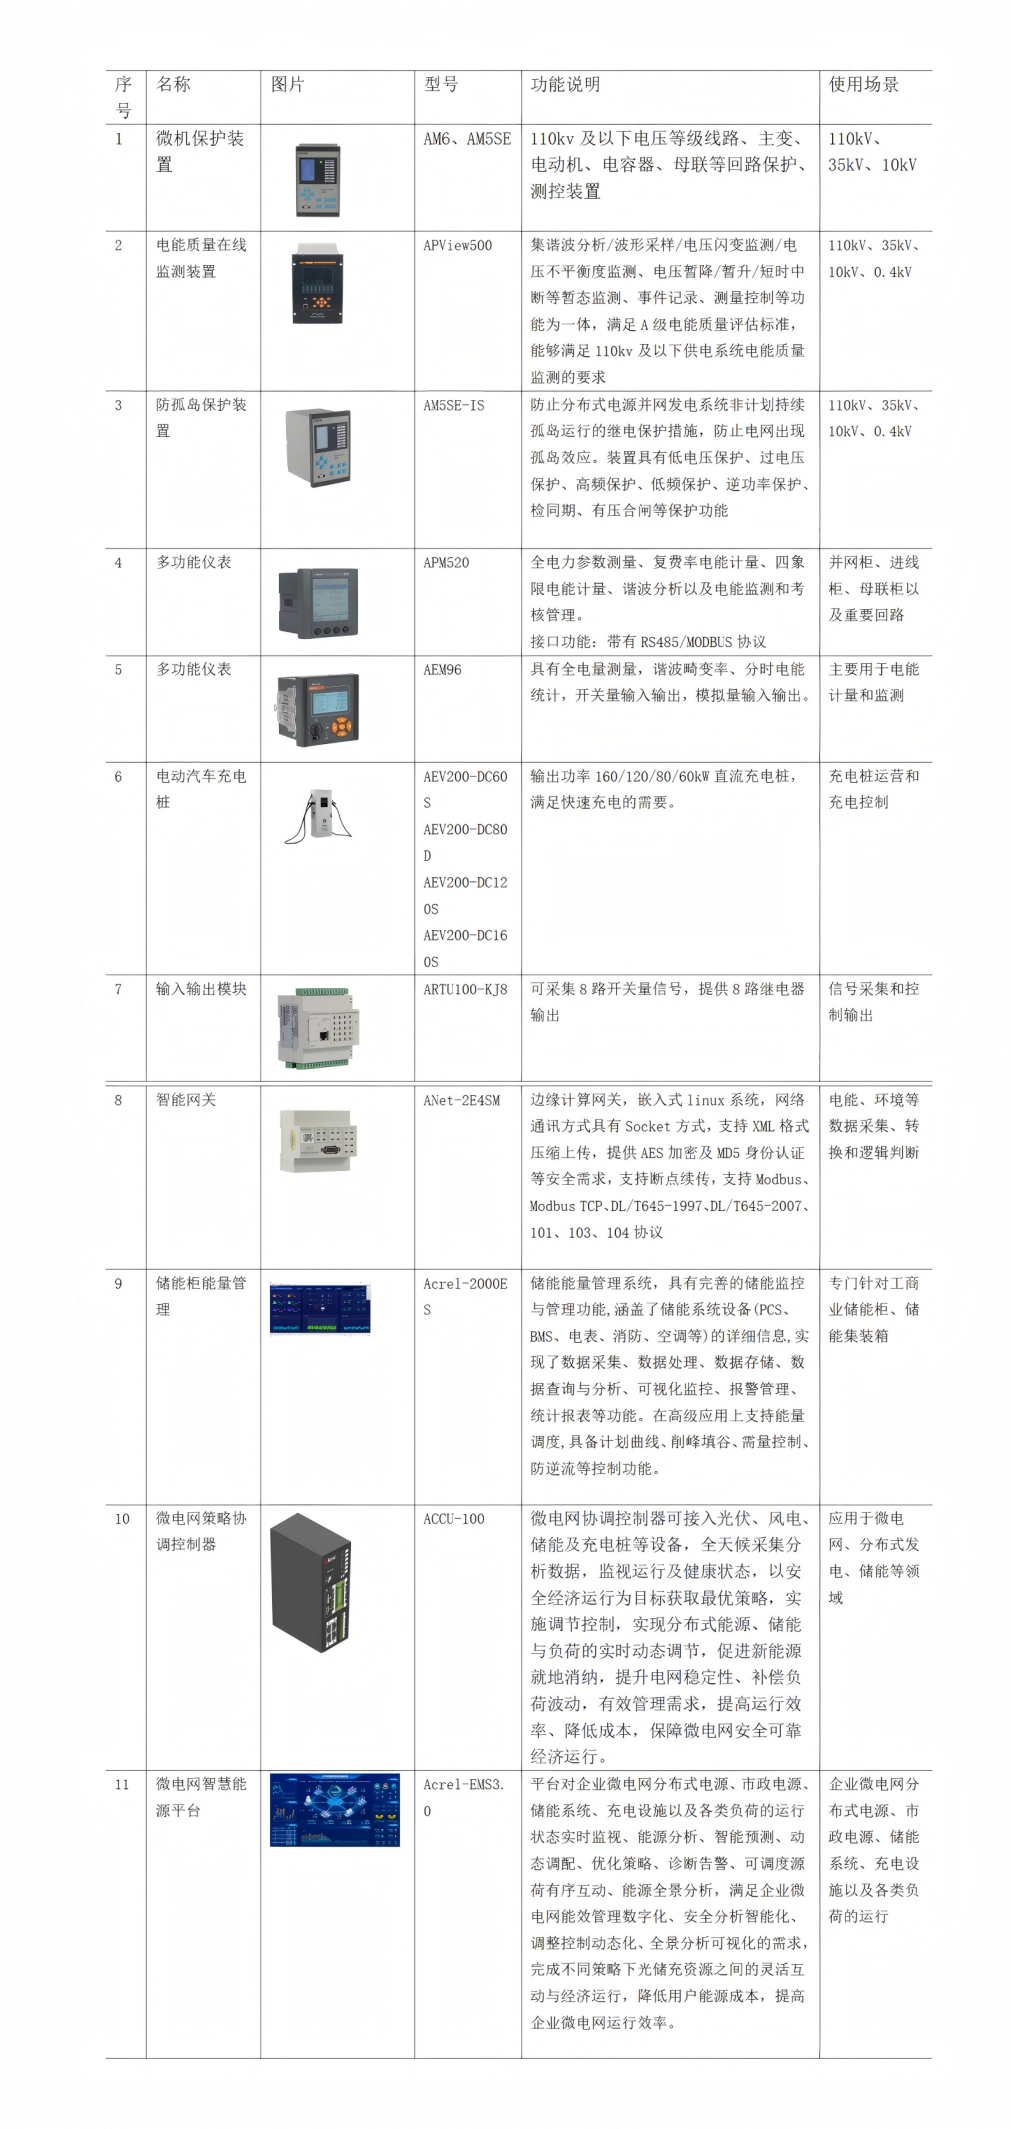
VI Solution related product recommendations
Conclusion:
The Implementation Plan for Accelerating the Integration of Source, Grid, Load, and Storage in Henan Province provides a replicable practical model for the whole country. Its core lies in achieving dynamic balance of the four links of the energy system's "source, grid, load, and storage" through panoramic monitoring technology. In the future, with the deep application of IoT, big data, and artificial intelligence technologies, the integration of source, network, load, and storage will evolve towards a more efficient and intelligent direction, contributing Chinese solutions to the global energy transformation.