-
E-mail
2802943235@qq.com
-
Phone
18702111683
-
Address
No. 253 Yulu Road, Jiading District, Shanghai
Ankerui Electric Co., Ltd
High speed service area photovoltaic storage direct flexible microgrid system
Date: 2025-11-05Read: 20
Introduction:
Driven by the global energy transition and carbon neutrality goals, the green upgrading of transportation infrastructure has become a key issue. As a hub of energy consumption and carbon emissions, the reform of the energy system in highway service areas is of great significance. The Light Storage Direct Flexible (PEDF) technology reshapes the energy ecology of service areas with the full chain optimization capability of "power generation storage electricity consumption regulation". On October 1, 2025, the National Development and Reform Commission and the Energy Administration issued a notice on improving the pricing mechanism to promote the nearby consumption of new energy generation, injecting policy momentum into the application of photovoltaic storage direct flexible technology in high-speed service areas, clarifying the quantitative standards for distributed photovoltaic nearby consumption, and solving the pain points of "difficult grid connection and weak consumption". This policy is in line with the advantages of photovoltaic direct flexible technology, which can enable service areas to achieve efficient on-site consumption of electricity and reduce dependence on the public power grid.

1 Light storage direct flexible solution becomes the cornerstone of energy transformation in service areas
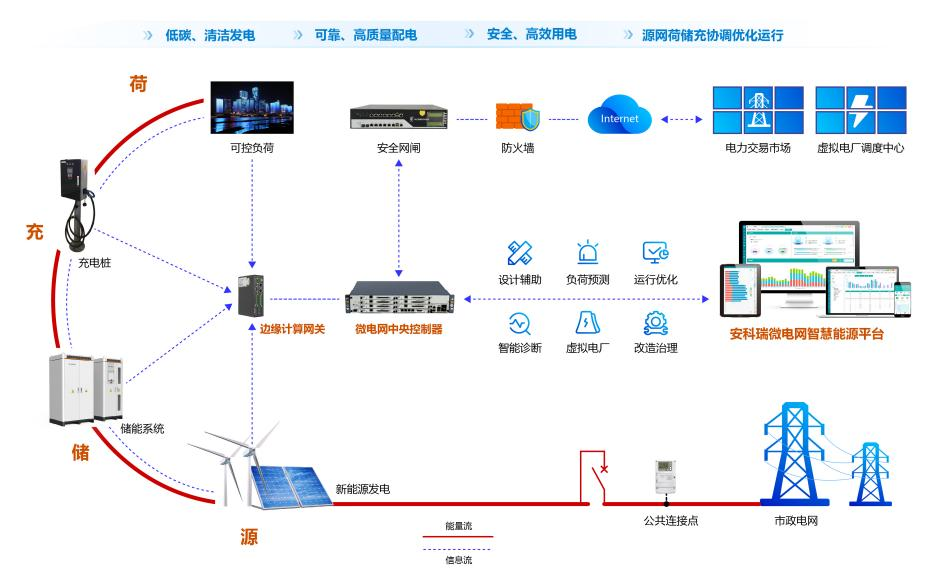
Building a flexible power supply and distribution system through the four technologies of "light, storage, straight, and flexible":
Light:On site production of clean energy through distributed photovoltaic modules, such assomeThe 3.2 MW photovoltaic system in the zero carbon service area generates over 10000 kWh of electricity per day, reducing reliance on traditional power grids.
Storage:Equipping energy storage systems (such as lithium iron phosphate batteries) to balance supply and demand, storing electricity during peak periods of photovoltaics, and discharging electricity at night or during peak periods of electricity consumption, achieving "peak shaving and valley filling".
Straight:Replacing AC systems with DC distribution architecture reduces conversion losses, seamlessly integrates photovoltaic, energy storage, and DC loads, and simplifies the power grid structure.
Soft:By using flexible control technology, the building's electricity load can be flexible, and power can be dynamically adjusted according to the supply and demand of the power grid, achieving "source load interaction".
Adaptability of high-speed service areas: cracking three major pain points
Space time mismatch of energy supply and demand:There is a time difference between photovoltaic power generation and charging demand (such as the peak of photovoltaic output at noon and the low point of charging), and the energy storage system can store excess electricity for nighttime use.
Grid connection pressure:The photovoltaic storage direct flexible system balances local energy production and consumption, reduces dependence on the public power grid, and alleviates regional power grid capacity pressure.
High operating costs:Reduce electricity expenses by arbitrage between peak and valley electricity prices and increasing self consumption rates. For example, after the application of the light storage direct flexible system in a certain highway service area, the annual electricity cost was saved by 1.8 million yuan.
II Core Function: Empowering Service Areas with Four Major Abilities
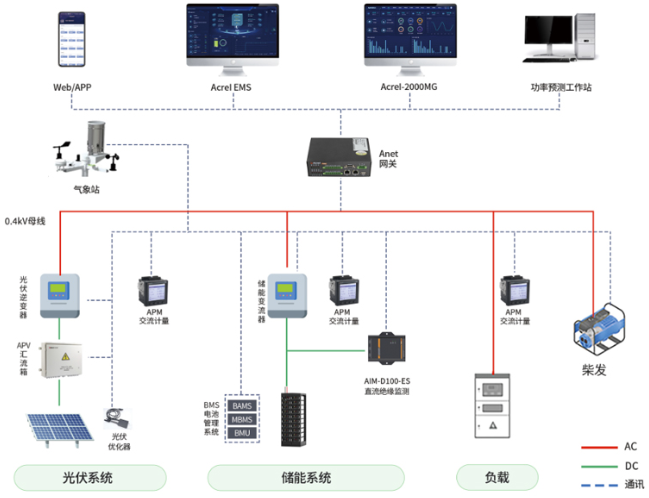
Multi source collaborative control:Support the conversion and unified scheduling of photovoltaic, energy storage, charging stations, and mains power protocols to solve the problem of inefficient independent operation of equipment. Prioritize power supply and charging stations during peak photovoltaic periods, and store surplus energy; Energy storage during peak nighttime charging hours collaborates with the power grid to reduce price differences and costs. SVG and VSG technologies ensure stable grid connection and comply with international standards.
Intelligent prediction and optimization:Based on LSTM neural network to predict photovoltaic power (error<5%), optimize energy storage strategy by combining meteorological and historical data. Load forecasting accurately predicts demand based on production, equipment, and historical electricity data, achieving forward-looking allocation.
Data driven operation and maintenance:Evaluate the health of the equipment, warn of faults (such as IGBT overheating), reduce fault response time to 20 minutes, and lower operation and maintenance costs by 40%. Generate green electricity certificates, support carbon trading interfaces, and assist service areas in obtaining subsidies.
Carbon asset management:Real time monitoring of carbon emissions, providing emission reduction accounting and reporting, and assisting service areas in participating in carbon trading. After the application in a certain service area, carbon emissions were reduced by 60%, and the annual profit from green electricity trading was 600000 yuan.
III System Function Interface Display
3.1 Real time monitoring
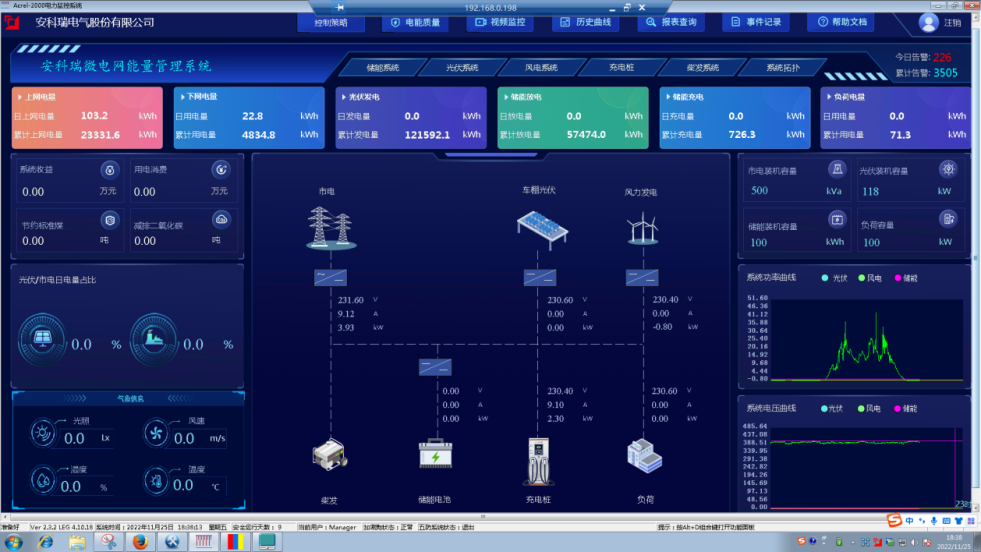
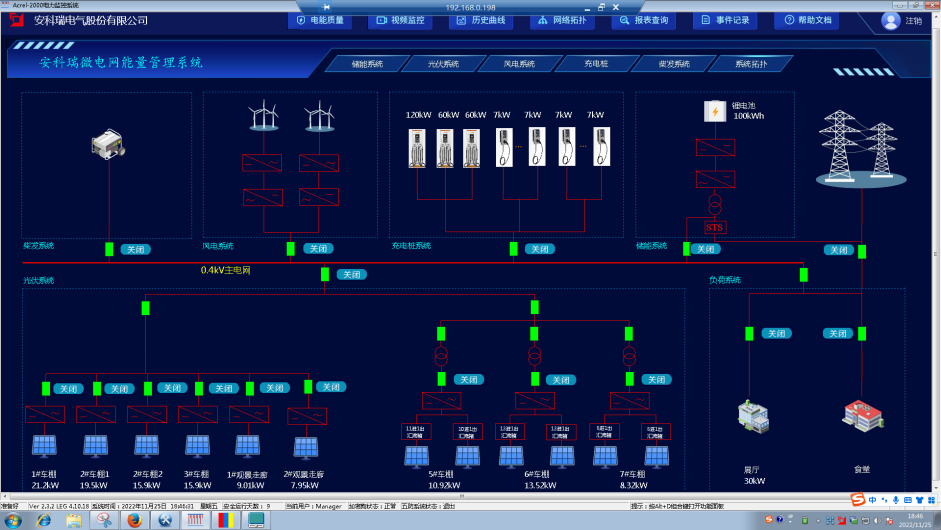
The monitoring system interface of the microgrid energy management system includes the system main interface, which includes the microgrid photovoltaic, wind power, energy storage, charging piles, and overall load composition, including revenue information, weather information, energy conservation and emission reduction information, power information, electricity quantity information, voltage and current situation, etc. According to different needs, charging, energy storage, and photovoltaic system information can also be displayed.
3.2 Photovoltaic Interface
Display information on photovoltaic systems, mainly including monitoring and alarm of the operating status of inverters on the DC and AC sides, statistics and analysis of inverter and power station power generation, monitoring and analysis of grid connected cabinet power generation, statistics of annual effective utilization hours of power station power generation, statistics of power generation revenue, carbon emission reduction statistics, monitoring of irradiance/wind power/environmental temperature and humidity, simulation and efficiency analysis of power generation; Simultaneously display the total power, voltage and current of the system, as well as the operational data of each inverter.
3.3 Energy storage interface
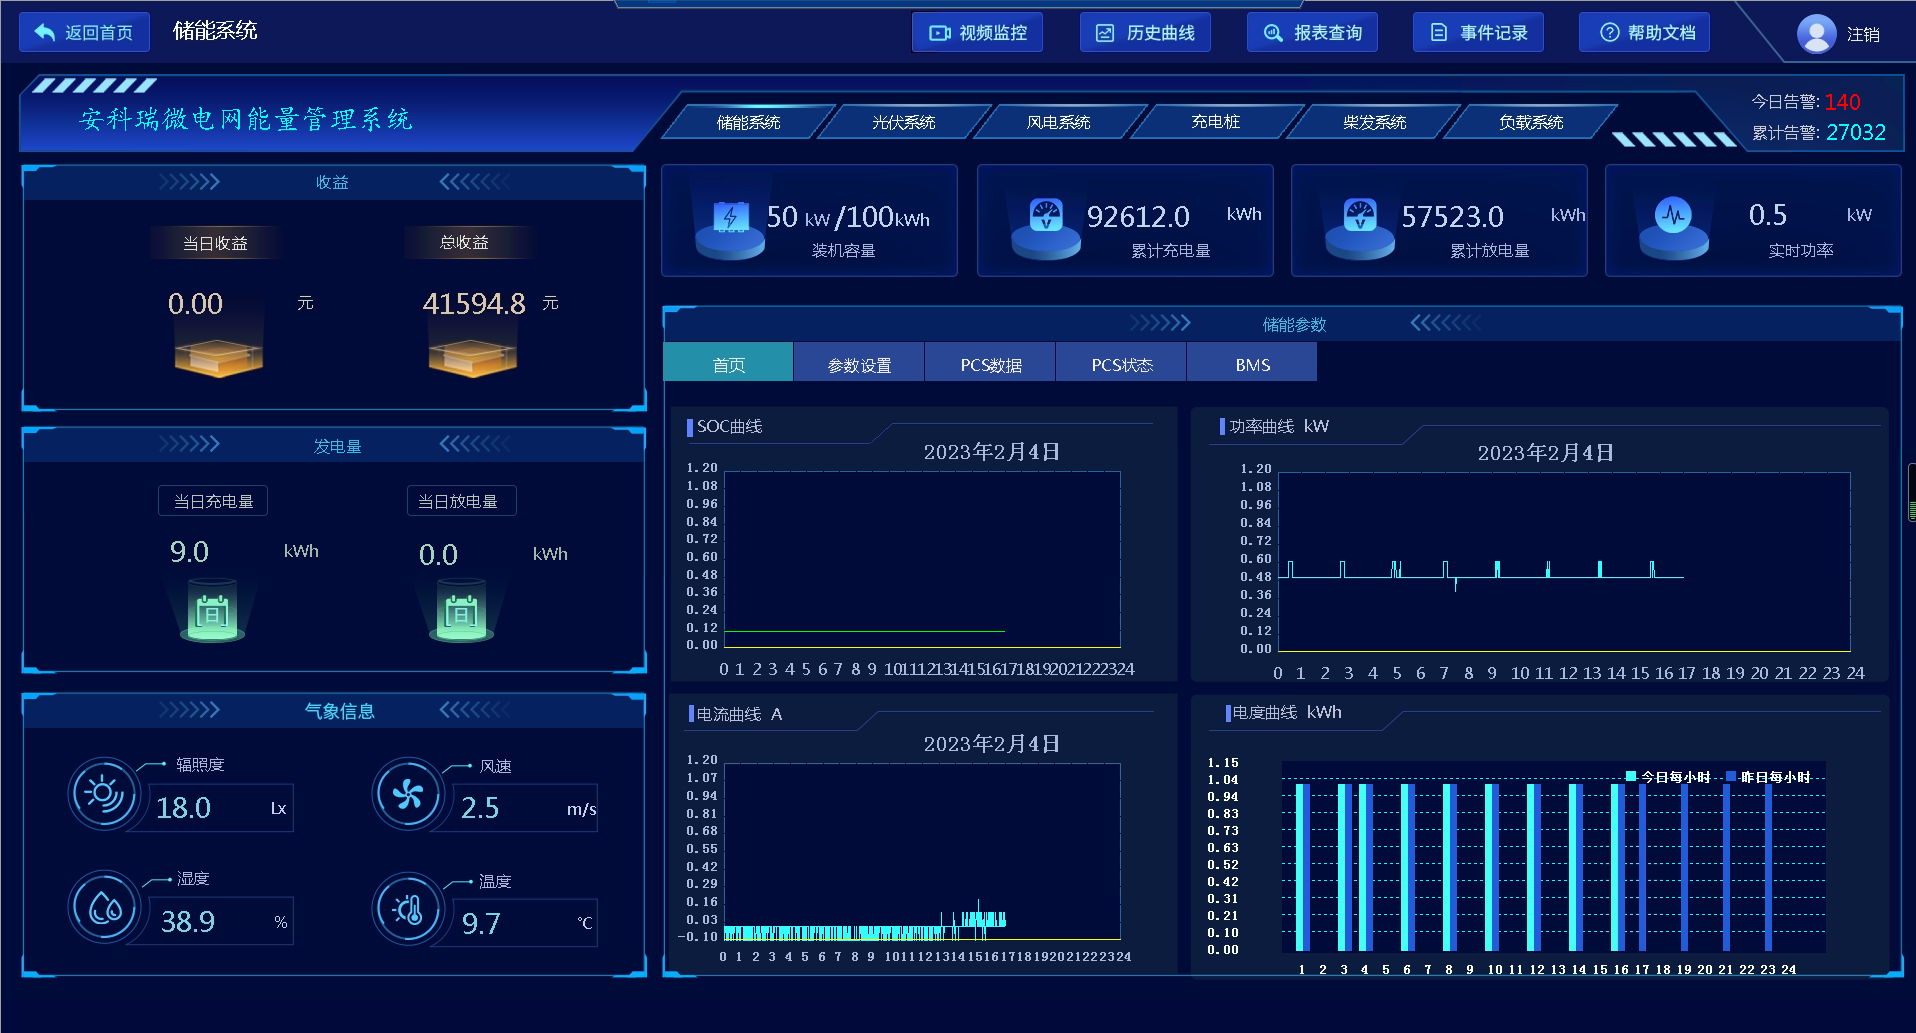
Display the energy storage installed capacity, current charging and discharging capacity, revenue, SOC change curve, and electricity change curve of this system. Data display and control of PCS and BMS.

3.4 Wind Power Interface
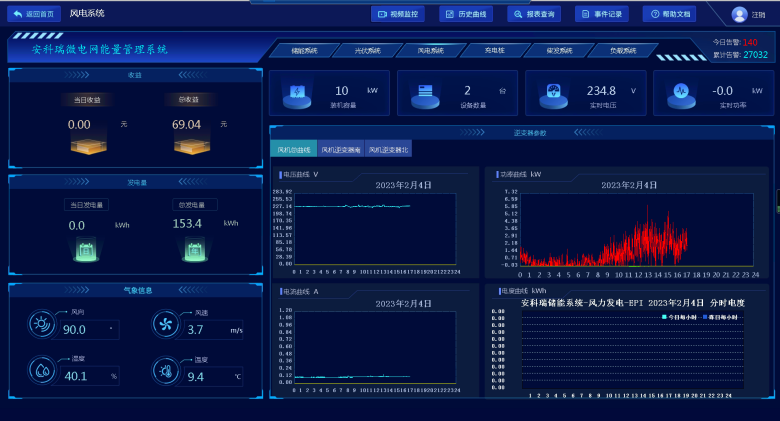
Display information on wind power systems, mainly including monitoring and alarm of the operation status of the DC and AC sides of the inverter control integrated machine, statistics and analysis of the power generation of the inverter and the power station, statistics of the annual effective utilization hours of the power station's power generation, statistics of power generation income, carbon reduction statistics, monitoring of wind speed/wind speed/environmental temperature and humidity, simulation of power generation and efficiency analysis; Simultaneously display the total power, voltage and current of the system, as well as the operational data of each inverter.
3.5 Charging Station Interface
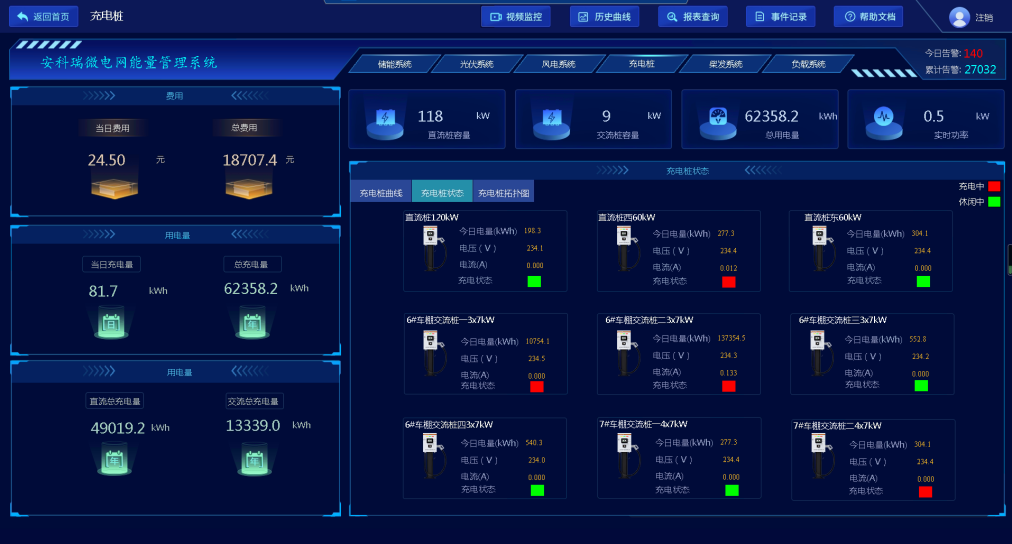
Display information about the charging station system, mainly including the total power consumption of charging stations, the power and electricity consumption of AC and DC charging stations, electricity costs, change curves, and operational data of each charging station.
3.6 Power generation forecast
Based on historical power generation data, measured data, and future weather forecast data, predict the short-term and ultra short term power generation of distributed power generation, and display the qualification rate and error analysis. According to power prediction, manual input or automatic generation of power generation plans can be carried out, which facilitates users to centrally control the new energy generation of the system.

3.7 Strategy Configuration
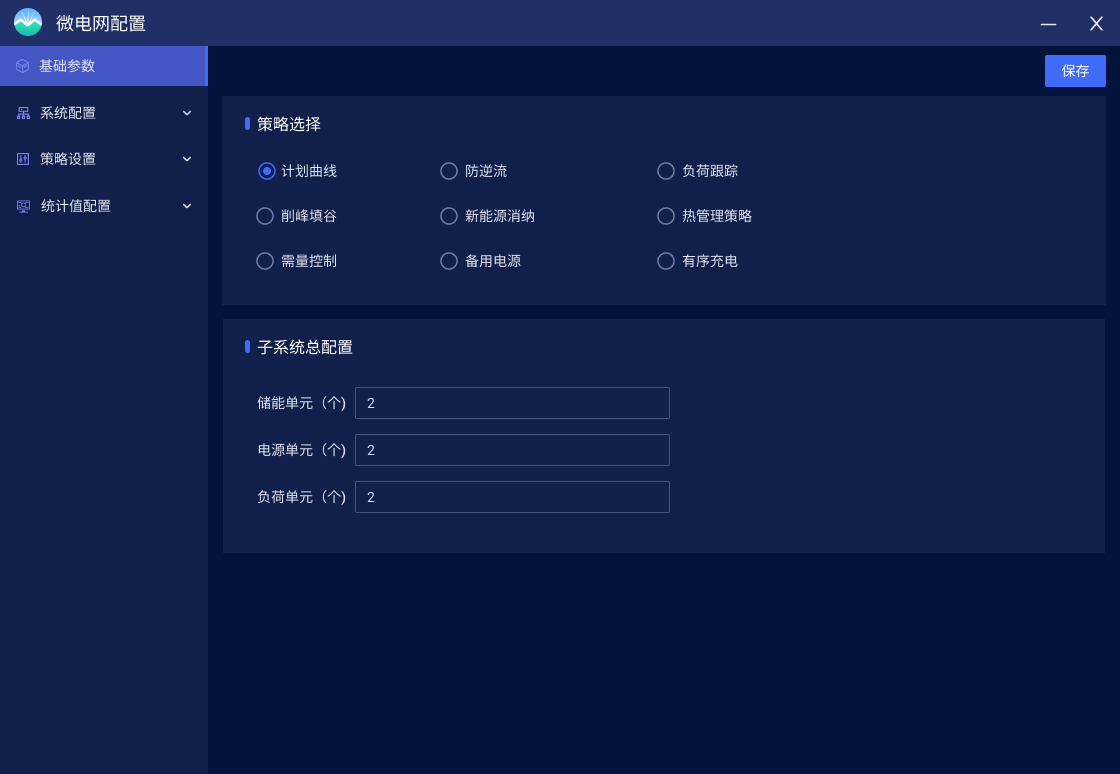
The system should be able to set the system operation mode and configure different control strategies based on power generation data, energy storage system capacity, load demand, and time of use electricity price information. Such as peak shaving and valley filling, cycle planning, demand control, anti backflow, orderly charging, dynamic expansion, etc.
3.8 Real-time alarm
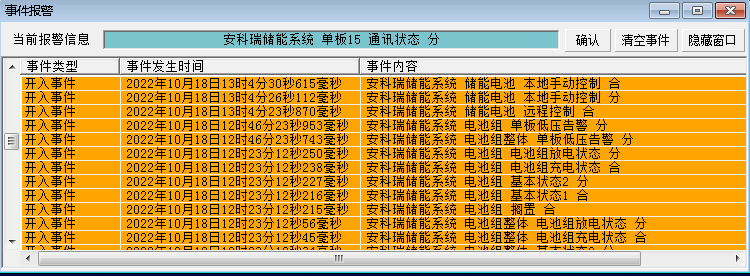
Equipped with real-time alarm function, the system should be able to remotely signal the starting and closing of inverters and bidirectional converters in each subsystem, as well as issue alarms when internal protection actions or accident trips occur. It should be able to display alarm events or trip events in real time, including the name of the protection event and the time of the protection action; And it should be able to notify relevant personnel in the form of pop ups, sounds, text messages, and phone calls.
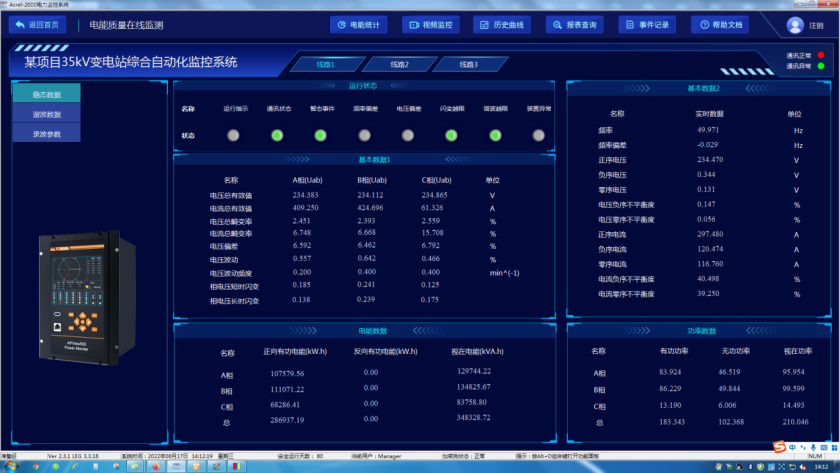
3.9 Power Quality Monitoring
Continuous monitoring of the power quality of the entire microgrid system, including steady-state and transient states, enables management personnel to grasp the power quality situation of the power supply system in real time, in order to timely detect and eliminate unstable power supply factors.
3.10 Network Topology Diagram
The system supports real-time monitoring of the communication status of various devices connected to the system, and can fully display the entire system network structure; It can diagnose the communication status of equipment online, and automatically display the faulty equipment or component and its faulty location on the interface when network abnormalities occur.
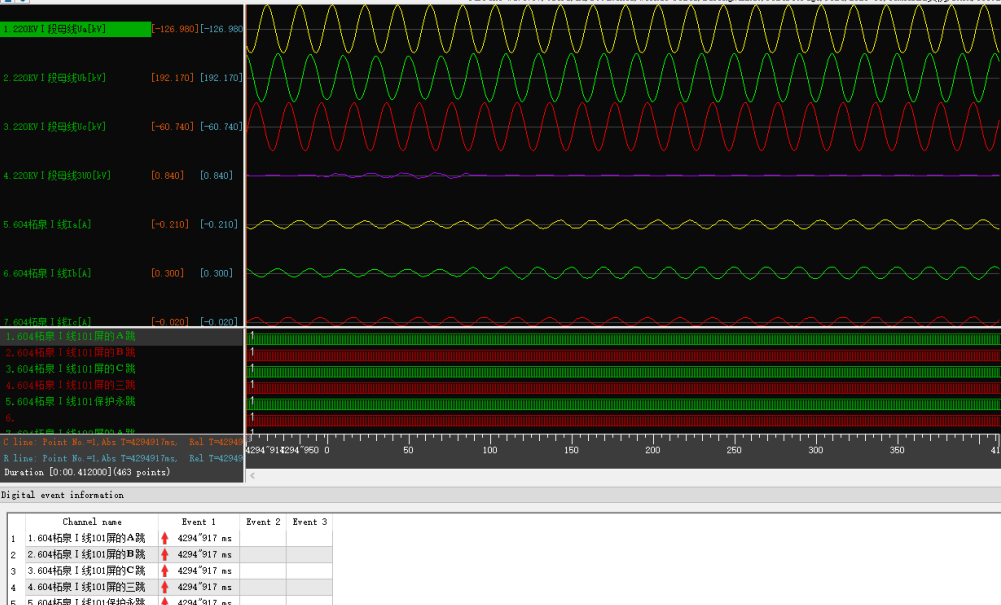
3.11 Fault recording
When the system malfunctions, it automatically and accurately records the changes in various related electrical quantities before and after the fault. By analyzing and comparing these electrical quantities, it plays an important role in analyzing and handling accidents, determining whether the protection is operating correctly, and improving the safe operation level of the power system. Among them, a total of 16 fault waveforms can be recorded, and each waveform can trigger 6 segments of waveform recording. Each waveform recording can record 8 cycles before the fault and 4 cycles after the fault, with a total recording time of 46 seconds. Each sampling point recording should include at least 12 analog waveforms and 10 switch waveforms.
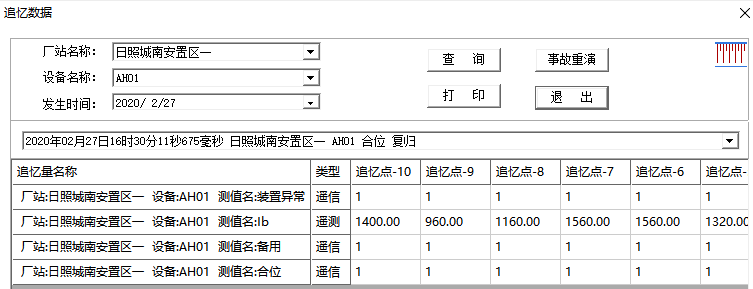
3.12 Accident Remembrance
It can automatically record all real-time scanning data before and after the accident, including switch position, protection action status, remote measurement, etc., forming the data basis for accident analysis;
Users can customize the start event for accident recall, and when each event occurs, store relevant point data for * * scan cycles before the accident and 10 scan cycles after the accident. The data points for initiating events and monitoring can be specified and modified by users at will.
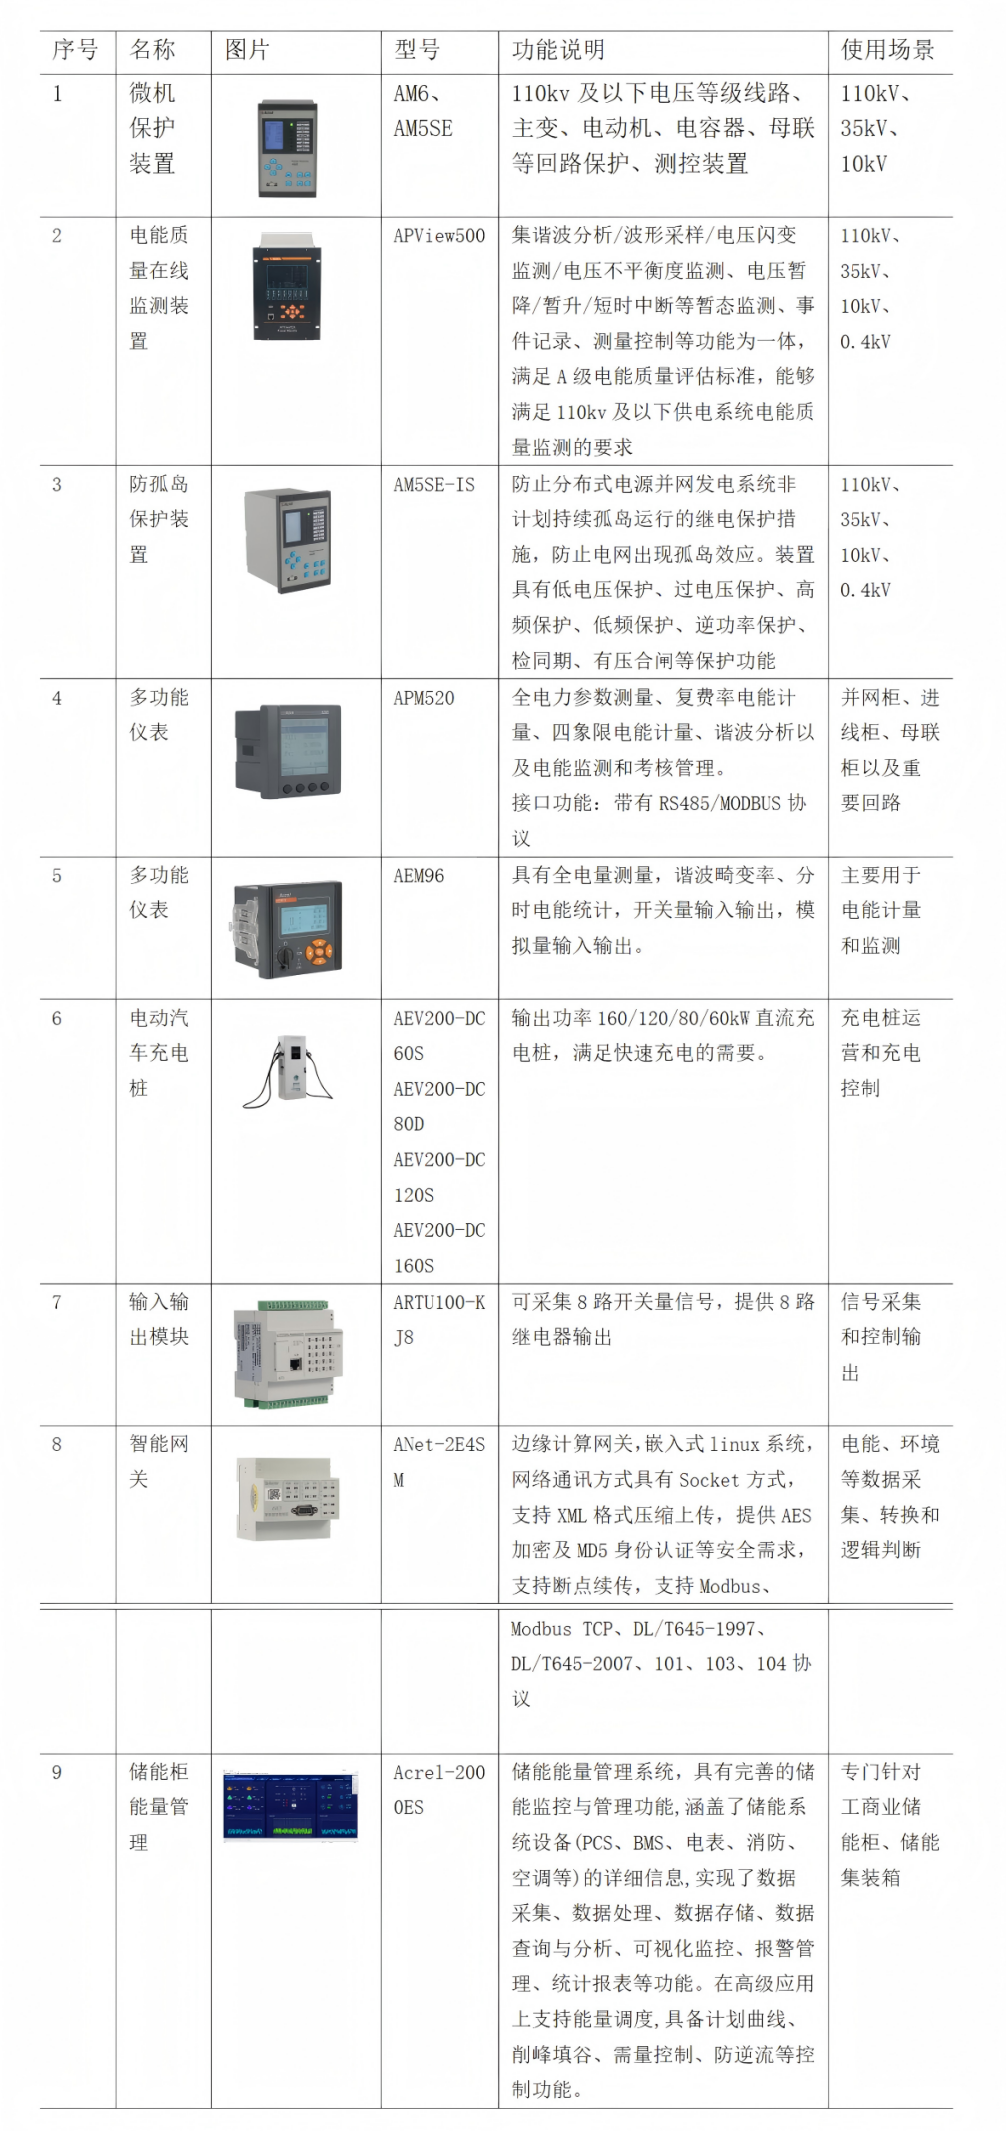
4 Solution related products
Conclusion:
The high-speed service area optical storage direct flexible system has reconstructed the energy supply paradigm in the transportation field through technological innovation and mode breakthroughs. It not only achieves zero carbon operation and intelligent upgrading of service areas, but also provides a "Chinese solution" for the green transformation of global transportation infrastructure. In the future, with the continuous reduction of technology costs and the improvement of standardization systems, the optical storage direct flexible system is expected to move from pilot demonstrations to large-scale promotion, becoming the core engine for promoting the achievement of carbon neutrality goals in the transportation industry. Its value is not only reflected in the direct benefits of energy conservation and emission reduction, but also in promoting the deep integration of transportation, energy and urban development through the construction of the energy Internet, so as to inject new momentum into the sustainable future.